This is a really neat web tool that Auckland Council have released:
This website helps you to easily find census information specifically for Auckland. It provides interactive mapping, graphing and data export functions. You can build your own graphs and tables by selecting a data category or the relevant area on the map.
Information, where available, is given for the 2001, 2006 and 2013 Censuses and more information will be added over time as data is released from Statistics New Zealand.
This online tool is brought to you by the Research, Investigations and Monitoring Unit (RIMU) at Auckland Council.
There’s one tool that lets you view and compare Census data between Auckland Local Boards, and another tool that lets you view and compare Census data across census area units (i.e. individual suburbs).
For example, I could drill into the data and found that:
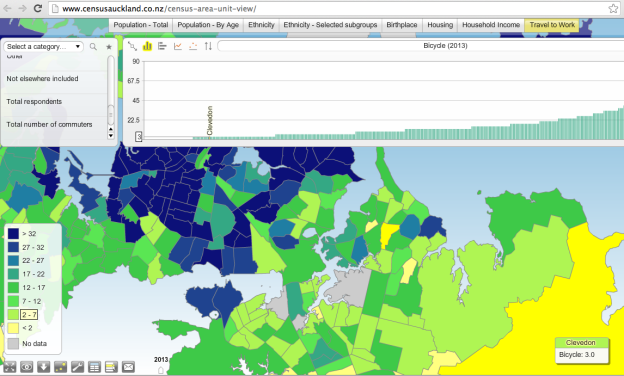
- On Census Day 2013, I was one of 18 people from Highland Park that cycled to work (vs. 1,401 by car/truck/van etc) – I guess that means no priority cycle lanes on Aviemore Drive…
- Howick Ward is the most populous ward in Auckland (127,125), second highest being Henderson-Massey (107,685).
- Nearly half of Howick Ward residents were born overseas (61,659 out of 127,125, 48.5%)
- 1 in 8 people living in the Howick Ward are 65 and over (15,993 out of 127,125, 12.6%) – lots of older folk
- 1 in 5 people living in the Howick Ward are aged 14 and under (25,194 out of 127,125, 19.8%) – so lots of young families as well
Lots of fun to play with – you can view stats on population, ethnicity, birthplace, housing, household income, and travel to work. And you can also view stats from the 2001 and 2006 Census data as well.